
Climate Stripes: Digital Artworks
The University Art Collection has accessioned two editions of Climate Stripes developed by Professor Ed Hawkins (National Centre for Atmospheric Science, University of Reading) into the collection as digitally produced artworks: Climate Stripes: Warming Stripes, Hay on Wye 2017 and Climate Stripes: Warming Stripes, Global 2020.
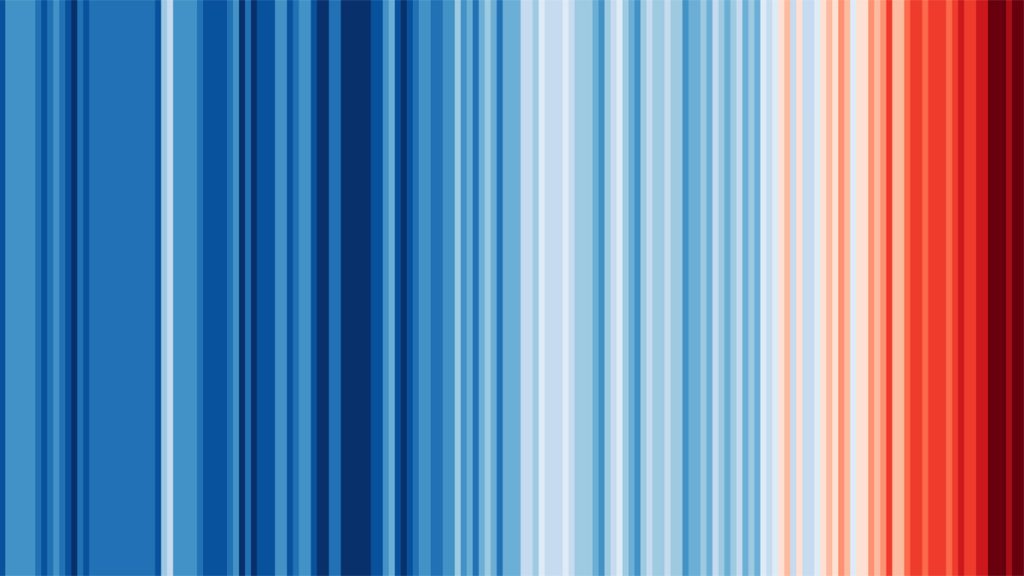
This simple pattern of coloured stripes is generated by the latest scientific data on climate change and represents the increase in temperatures since 1850, one stripe per year, with dark blues used for colder years, and dark reds for warmer years.
The stripes are now a global phenomenon, repurposed for everything from news bulletins, art installations and rock concerts, to adorning electric cars. As part of the University Art Collection, Climate Stripes will be preserved as a key moment in the University’s visual and institutional history. It also connects to the spirit of openness that lies behind the stripes, which have been made available for everybody to share, copy, remix, transform, and build upon for any purpose. By recognising them as artworks, we aim to extend their impact among new audiences and open more conversations about how human activities are fundamentally changing the weather and climate.
Climate Stripes: Warming Stripes, Hay-on-Wye 2017
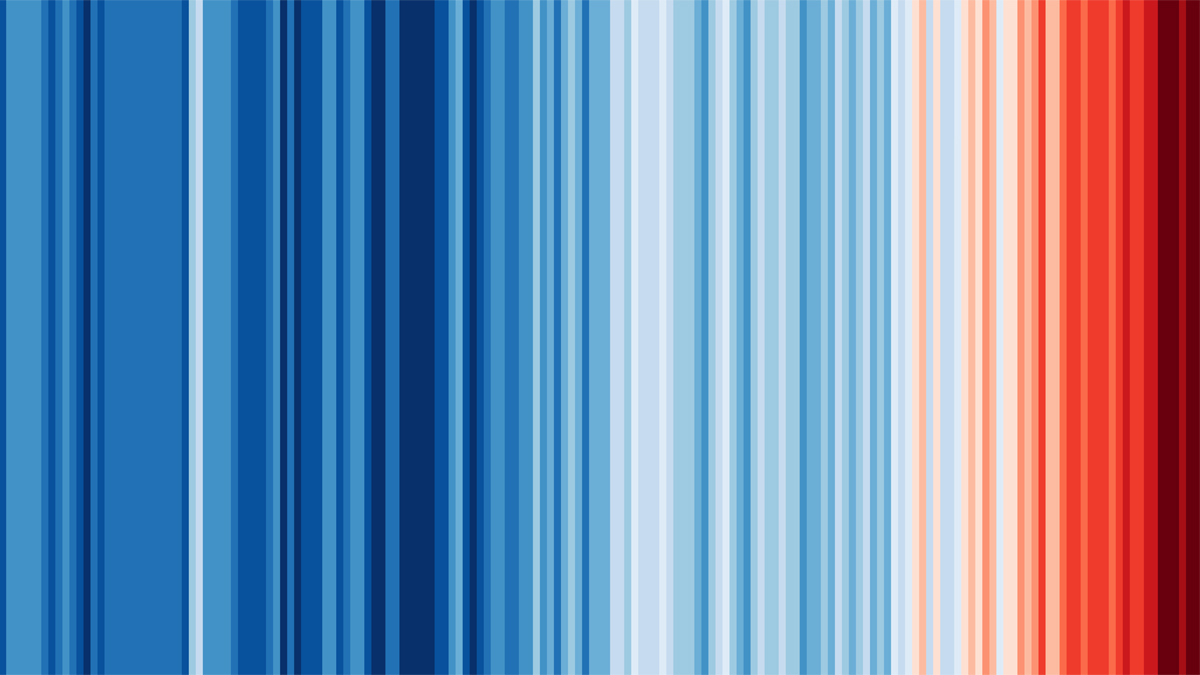
The first edition of the stripes Climate Stripes: Warming Stripes, Hay-on-Wye 2017 presented climate data for the Hay-on-Wye Festival in 2018. Professor Hawkins had been invited to present his research in conversation with the poet and author Nicola Davies, as part of a series art-science panels at that year’s literary festival which had a special focus on environmental issues. He developed the stripes as a means of simple, striking data visualization, presenting only local data for Hay-on-Wye up to the previous year.
A few days before he tweeted the image. The stripes were picked up by the American meteorologist and CBS weather presenter Jeff Berardelli. Berardelli printed the stripes on a tie and encouraged others, and especially other broadcast meteorologists, to wear a piece of clothing featuring the stripes for a #metsunite initiative on 21 June 2018. #metsunite soon became the annual #showyourstripes event, which takes place on the Summer Solstice each year and bears testament the power of the stripes as a living tool of climate education.
Ed Hawkins, Climate Stripes: Warming Stripes, Hay-on-Wye 2017, Digital, 2018.
Climate Stripes: Warming Stripes, Global 2020
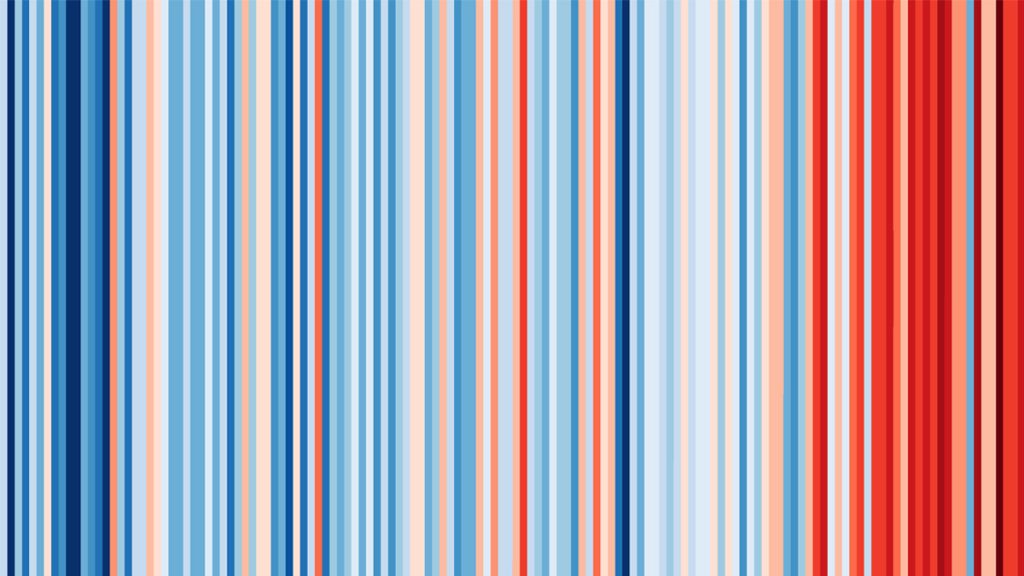
The Global 2020 edition of the stripes charts data up to the end of 2020, an exceptional year in so many respects. It is the most widely used stripes image in connection the University’s work around climate education and COP26.
The ability to juxtapose these two digital artworks within the collection promotes a stark truth – compare and contrast the two images in this exhibition and notice the dark red lines added to the 2020 edition.
Hawkins describes Climate Stripes as a data visualization. As he later discovered, the stripes already had precedents in creative projects such as Ellie Highwood’s Climate Change Blanket from 2017 and the concept had been around in knitting community for a long time – it was just that no-one had yet used computer generated graphics. Via the #showyourstripes website, graphics of the stripes can be freely downloaded for around 200 countries and US states, as well as for the world as a whole.
Ed Hawkins, Climate Stripes: Warming Stripes, Global 2020, Digital, 2021.